Dixon Technologies saw a stock decline of around 7.5% following its Q2 earnings report, which highlighted a shift in business dynamics affecting profitability. Despite significant revenue growth of 133% to ₹11,534 crore and an EBITDA increase of over 100%, margins were impacted by a higher contribution from the low-margin mobile business. The EBITDA margin for the quarter was 3.6%, a 40 basis-point decrease from the previous year’s 4%.
The company’s consolidated profit was bolstered by an exceptional one-time gain of ₹210 crore, tied to Dixon’s 6.5% stake in Aditya Infotech Ltd. This gain came after Dixon restructured its joint venture with Aditya Infotech, in which Dixon sold its 50% stake in AIL Dixon to its partner and received a stake in Aditya Infotech in exchange. Aditya Infotech is expected to launch an IPO by late FY25 or early FY26, with increased focus on backward integration and design. Excluding this fair value gain, Dixon’s consolidated profit still grew by 78%.
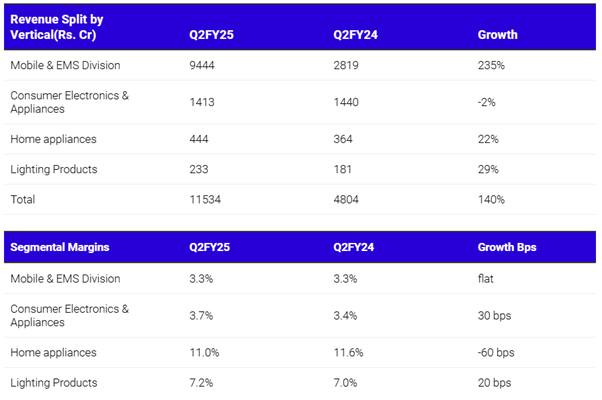
Segment Analysis and Key Contributors
The mobile division was the standout performer, reporting a 235% increase in revenue compared to last year. Now comprising around 81% of Dixon’s total revenue, this growth was fueled by a surge in orders and the integration of Ismartu, which Dixon acquired in 2023. From mid-August to the end of September alone, Ismartu contributed approximately ₹1,100 crore. The increased revenue share of the mobile division, however, has impacted margins. Dixon’s CFO, Saurabh Gupta, noted that margin support will come from Dixon’s investment in the components business, expected to add at least 100 basis points to margins in the next 12-18 months.
In the home appliances segment, Dixon posted a revenue increase of 22% to ₹444 crore, though margins fell by 60 basis points to 11%. Within this segment, the washing machines division saw monthly production reach 30,000 units, demonstrating steady growth. The consumer electronics division, producing refrigerators and LED TVs, achieved 90% capacity utilization, manufacturing 1.2 million refrigerator units with plans to increase this to 1.6 million. Dixon supplies key clients, including Voltas, Kelvinator, Acer, and BPL. However, the LED TV segment faced a subdued performance this quarter, in line with broader industry trends.
New Growth Avenues
Dixon is expanding into the telecom and IT hardware segments, anticipating 3x growth in telecom revenue for FY25 due to opportunities in 5G Fixed Wireless Access. Plans to double production capacity in this division are underway. In IT hardware, the company has secured partnerships with major brands HP, Asus, Lenovo, and Acer for laptop manufacturing. Revenue from IT hardware is projected to reach ₹4,500 crore to ₹5,000 crore by FY26.
Future Guidance and Strategic Investments
Dixon’s FY25 revenue guidance stands at around ₹32,000 crore, with a capital expenditure (capex) target of ₹580 crore for the year, ₹370 crore of which was spent in H1. As the company ventures further into the components sector, Dixon expects margins to improve over the next 15-18 months, offsetting current pressures from the high share of low-margin business in its portfolio.