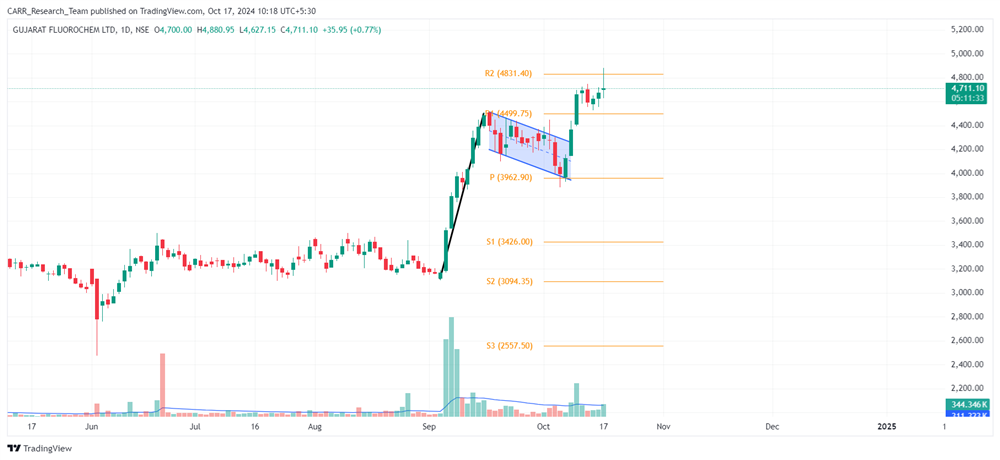
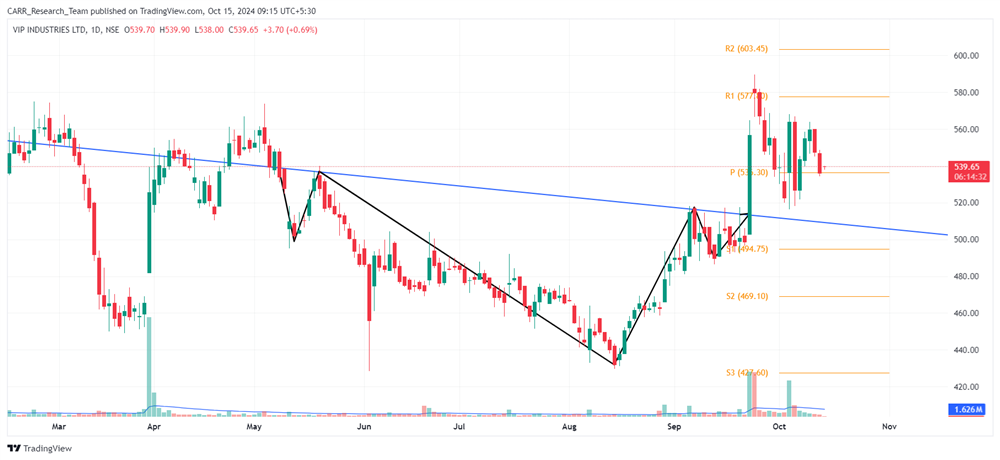
Stock name: Gujarat Fluorochemicals Ltd.
Pattern: Flag and pole pattern
Time frame: Daily
Observation:
In early September 2024, the stock experienced a sharp rise, followed by consolidation starting on September 17th. This formed a flag and pole pattern on its daily chart. The stock broke out of this pattern on October 9, 2024, followed by a strong green candle and significant trading volume. If the stock maintains its current momentum, technical analysis suggests it may see further upward movement. It's advisable to look for additional confirmations, such as RSI levels and the MACD indicator.
You may add this to your watch list to understand further price action.
Disclaimer: This analysis is purely for educational purpose and does not contain any recommendation. Please consult your financial advisor before taking any financial decision.

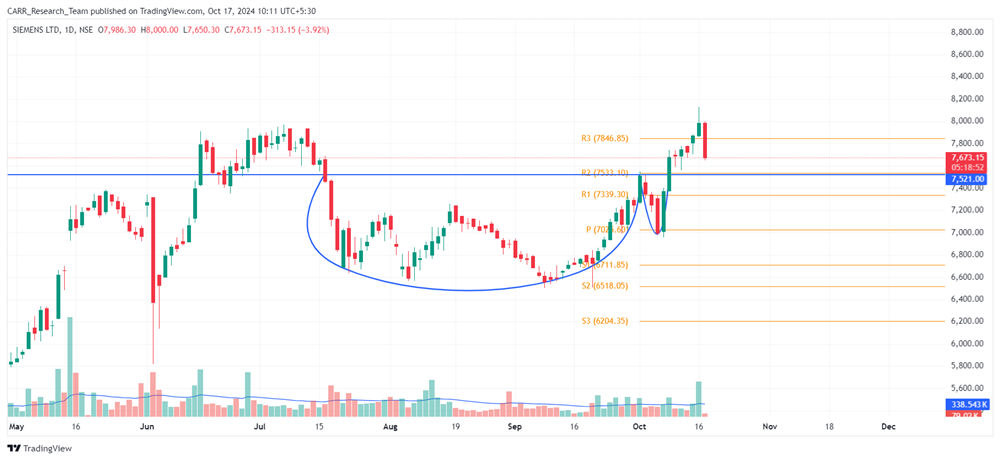
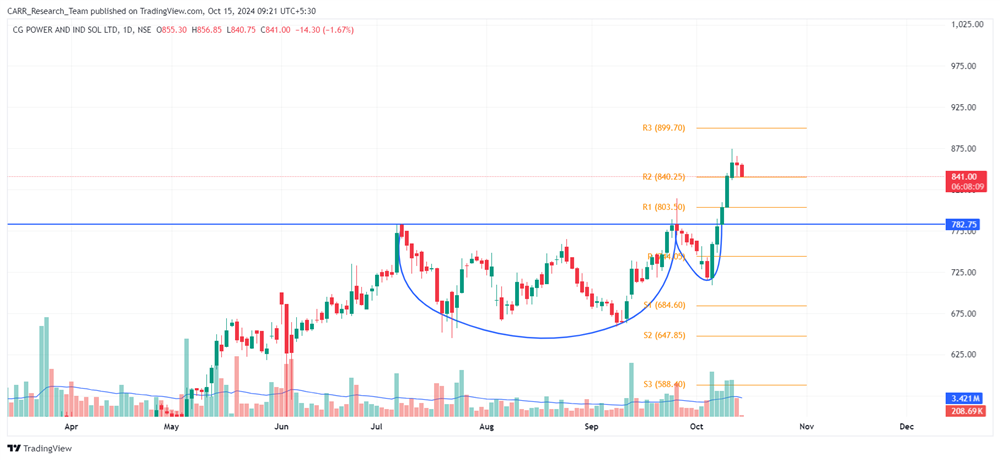
Stock name: Siemens Ltd.
Pattern: Cup and handle pattern
Time frame: Daily
Observation:
The stock has been on an upward trend since November 2023 and formed a cup and handle pattern between July and October 2024. It broke out of this pattern on October 9, 2024, and continued rising. On October 16, 2024, the stock saw further gains with significant volume. If the momentum holds, technical analysis suggests the stock may see more upward movement
It's advisable to look for additional confirmations, such as RSI levels and the MACD indicator.
You may add this to your watch list to understand further price action.
Disclaimer: This analysis is purely for educational purpose and does not contain any recommendation. Please consult your financial advisor before taking any financial decision.


_400.png "What’s happening with this bank?")